ChartPointSeriesStyle, Need another dimension |
Post Reply 
|
| Author | |
mwpMullan 
Newbie 
Joined: 30 November 2010 Location: New York City Status: Offline Points: 4 |
 Post Options Post Options
") Thanks(0) Thanks(0)
 Quote Reply Quote Reply
 Topic: ChartPointSeriesStyle, Need another dimension Topic: ChartPointSeriesStyle, Need another dimensionPosted: 05 September 2012 at 10:05am |
|
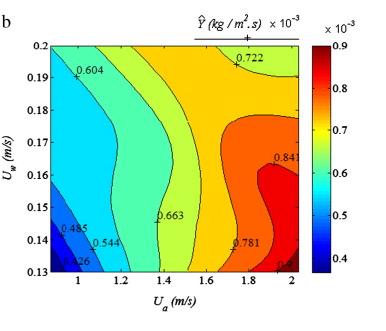
I need to plot a 3rd Dimension (and possibly a 4th) in a 2d plot.
I'd like to be able to specify the RGB color for EACH point as it is added. In this case, the RGB identifies the parameter I'm measuring (you could think of it as altitude), where X and Y represent physical axises in the real world. So imagine a 2d Topological map. Is this possible? Available in next release? Available already? Custom code?
|
|
 |
|
|
DKnowles
Groupie 

Joined: 03 April 2012 Status: Offline Points: 12 |
Post Options
Thanks(0)
Quote Reply
Posted: 14 September 2012 at 10:34am |
|
Kinda like this?
 |
|
|
|
|
mwpMullan
Newbie
Joined: 30 November 2010 Location: New York City Status: Offline Points: 4 |
Post Options
Thanks(0)
Quote Reply
Posted: 14 September 2012 at 3:32pm |
|
Yeah! A lot like that!
:-) |
|
|
|
|
DKnowles
Groupie
Joined: 03 April 2012 Status: Offline Points: 12 |
Post Options
Thanks(0)
Quote Reply
Posted: 17 September 2012 at 11:02am |
|
Hmm... Doesn't look like it is possible at the moment.
I thought I could possibly pull it off using the SplineAreaSeries style and playing around with the ArgumentScaleType and the ValueScaleType properties. But alas it just refuses to draw as I wish it to appear. |
|
|
|
|
Post Reply
|
|
 Tweet
Tweet
|
| Forum Jump | Forum Permissions You cannot post new topics in this forum You cannot reply to topics in this forum You cannot delete your posts in this forum You cannot edit your posts in this forum You cannot create polls in this forum You cannot vote in polls in this forum |


 Topic Options