ChartPointSeriesStyle, Need another dimension
Printed From: Codejock Forums
Category: Codejock Products
Forum Name: Chart Control
Forum Description: Topics Related to Codejock Chart Control
URL: http://forum.codejock.com/forum_posts.asp?TID=20111
Printed Date: 25 July 2026 at 10:16am
Software Version: Web Wiz Forums 12.04 - http://www.webwizforums.com
Topic: ChartPointSeriesStyle, Need another dimension
Posted By: mwpMullan
Subject: ChartPointSeriesStyle, Need another dimension
Date Posted: 05 September 2012 at 10:05am
|
I need to plot a 3rd Dimension (and possibly a 4th) in a 2d plot. I'd like to be able to specify the RGB color for EACH point as it is added. In this case, the RGB identifies the parameter I'm measuring (you could think of it as altitude), where X and Y represent physical axises in the real world. So imagine a 2d Topological map. Is this possible? Available in next release? Available already? Custom code?
|
Replies:
Posted By: DKnowles
Date Posted: 14 September 2012 at 10:34am
Kinda like this?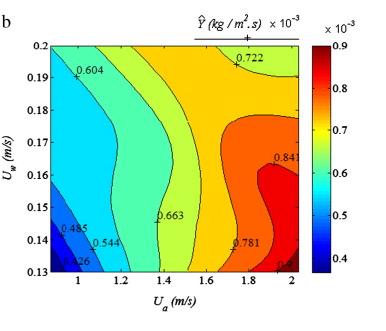 |
Posted By: mwpMullan
Date Posted: 14 September 2012 at 3:32pm
|
Yeah! A lot like that! :-) |
Posted By: DKnowles
Date Posted: 17 September 2012 at 11:02am
|
Hmm... Doesn't look like it is possible at the moment. I thought I could possibly pull it off using the SplineAreaSeries style and playing around with the ArgumentScaleType and the ValueScaleType properties. But alas it just refuses to draw as I wish it to appear. |