Stacked area doubt (see image) |
Post Reply 
|
| Author | |
znakeeye 
Senior Member 

Joined: 26 July 2006 Status: Offline Points: 1672 |
 Post Options Post Options
") Thanks(0) Thanks(0)
 Quote Reply Quote Reply
 Topic: Stacked area doubt (see image) Topic: Stacked area doubt (see image)Posted: 20 June 2011 at 2:26am |
|
Try modifying your ChartBrowser stacked area sample to only contain these points: Series1: (2005, 379) Series2: (2007, 365) (2008, 379) (2009, 470) Series3: (2005, 240) (2008, 405) (2009, 348) Series4: (2006, 260) (2007, 267) Then you get this chart: 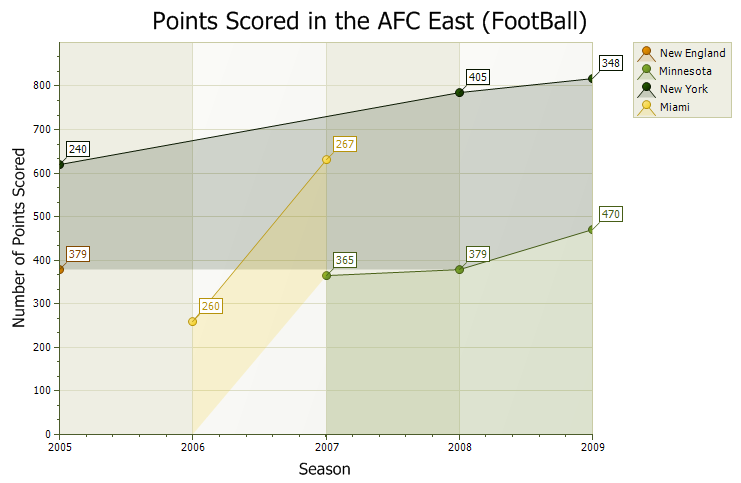 I believe this is correct, but still... I mean, sometimes series are incomplete when put in the whole set of data... Or would that be statistically incorrect for such a graph?
|
|
|
PokerMemento - http://www.pokermemento.com/
|
|
 |
|
|
znakeeye
Senior Member
Joined: 26 July 2006 Status: Offline Points: 1672 |
Post Options
Thanks(0)
Quote Reply
Posted: 20 June 2011 at 5:12pm |
|
Oleg, SuperMario? :)
I think that would make sense! If you don't specify a value, then there was no change!
|
|
|
PokerMemento - http://www.pokermemento.com/
|
|
|
|
|
Post Reply
|
|
 Tweet
Tweet
|
| Forum Jump | Forum Permissions You cannot post new topics in this forum You cannot reply to topics in this forum You cannot delete your posts in this forum You cannot edit your posts in this forum You cannot create polls in this forum You cannot vote in polls in this forum |


")


 Topic Options