Stacked area doubt (see image)
Printed From: Codejock Forums
Category: Codejock Products
Forum Name: Chart Control
Forum Description: Topics Related to Codejock Chart Control
URL: http://forum.codejock.com/forum_posts.asp?TID=18569
Printed Date: 10 May 2024 at 4:57pm
Software Version: Web Wiz Forums 12.04 - http://www.webwizforums.com
Topic: Stacked area doubt (see image)
Posted By: znakeeye
Subject: Stacked area doubt (see image)
Date Posted: 20 June 2011 at 2:26am
|
Try modifying your ChartBrowser stacked area sample to only contain these points: Series1: (2005, 379) Series2: (2007, 365) (2008, 379) (2009, 470) Series3: (2005, 240) (2008, 405) (2009, 348) Series4: (2006, 260) (2007, 267) Then you get this chart: 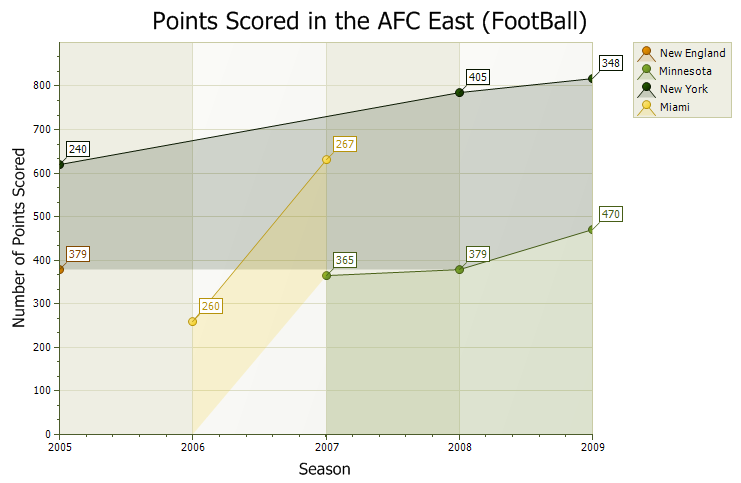 I believe this is correct, but still... I mean, sometimes series are incomplete when put in the whole set of data... Or would that be statistically incorrect for such a graph?
------------- PokerMemento - http://www.pokermemento.com/ |
Replies:
Posted By: znakeeye
Date Posted: 20 June 2011 at 5:12pm
|
Oleg, SuperMario? :) I think that would make sense! If you don't specify a value, then there was no change! ------------- PokerMemento - http://www.pokermemento.com/ |