How do you set the base Axis value |
Post Reply 
|
| Author | |
RobertInTpa 
Groupie 
Joined: 18 February 2011 Location: Tampa Status: Offline Points: 31 |
 Post Options Post Options
") Thanks(0) Thanks(0)
 Quote Reply Quote Reply
 Topic: How do you set the base Axis value Topic: How do you set the base Axis valuePosted: 18 February 2011 at 6:13pm |
|
When I chart some data points, all the data points are positive numbers
10,200,2000,4000 However, when the chart displays, it is like this: 5000 4000 3000 2000 1000 0 -100 Now, all of my points are positive numbers so the bottom number should be zero (0) --- is there something I'm missing or how can I tell the chart that the base should be zero - or why is it showing a negative number in the scale for no reason? Thank you. |
|
|
Product: Active-X Chart Control 16, Active-X Calendar & Chart Controls
Platform: Windows 7 32-bit Language: Clarion 8.0 |
|
 |
|
|
Aaron
Senior Member 

Joined: 29 January 2008 Status: Offline Points: 2192 |
Post Options
Thanks(0)
Quote Reply
Posted: 20 February 2011 at 6:40am |
|
Hi, If you only add positive values, scale should be zero unless you assigned Diagram.AxisX.Range.MinValue = negative number
or
Diagram.AxisY.Range.MinValue= negative number
If not please show what you did...
|
|
|
Product: Xtreme SuitePro (ActiveX) version 15.0.2
Platform: Windows XP (32bit) - SP 2 Language: Visual Basic 6.0 Zero replies is not an option.... |
|
|
|
|
RobertInTpa
Groupie
Joined: 18 February 2011 Location: Tampa Status: Offline Points: 31 |
Post Options
Thanks(0)
Quote Reply
Posted: 21 February 2011 at 4:06pm |
|
Hi,
I actually did not set anything in the Diagram object (did not even touch it) All I did was add data series ... and it is doing this. I added a series and then used these: ChartPro_Result = ChartPro4.SetSeriesProperty('!' &DU:XAXIS, 'ArgumentScaleType', xtpChartScaleQualitative) ChartPro_Result = ChartPro4.SetSeriesProperty('!' &DU:XAXIS, 'ValueScaleType ', xtpChartScaleNumerical) and then I put my data in there And boom, I see numbers in the axis less than zero, and all points are greater than zero. |
|
|
Product: Active-X Chart Control 16, Active-X Calendar & Chart Controls
Platform: Windows 7 32-bit Language: Clarion 8.0 |
|
|
|
|
Oleg
Admin Group 
Joined: 21 May 2003 Location: United States Status: Offline Points: 11234 |
Post Options
Thanks(0)
Quote Reply
Posted: 22 February 2011 at 1:25am |
|
Hi,
yes, if you don't like how AutoRange worked for you, you can set Range manually with AxisY.Range property.
|
|
|
Oleg, Support Team
CODEJOCK SOFTWARE SOLUTIONS |
|
|
|
|
Aaron
Senior Member
Joined: 29 January 2008 Status: Offline Points: 2192 |
Post Options
Thanks(0)
Quote Reply
Posted: 22 February 2011 at 2:49am |
Hi Oleg,
Should it show negative values? I can't reproduce it in any way. I tried:
Thanks
|
|
|
Product: Xtreme SuitePro (ActiveX) version 15.0.2
Platform: Windows XP (32bit) - SP 2 Language: Visual Basic 6.0 Zero replies is not an option.... |
|
|
|
|
Oleg
Admin Group
Joined: 21 May 2003 Location: United States Status: Offline Points: 11234 |
Post Options
Thanks(0)
Quote Reply
Posted: 22 February 2011 at 3:33am |
|
Hi,
Not really sure what is problem for RobertInTpa. if there is point with y = -100, why its problem to show it.
|
|
|
Oleg, Support Team
CODEJOCK SOFTWARE SOLUTIONS |
|
|
|
|
Aaron
Senior Member
Joined: 29 January 2008 Status: Offline Points: 2192 |
Post Options
Thanks(0)
Quote Reply
Posted: 22 February 2011 at 4:07am |
That's not what he said... He assigned positive values and axes show negative values. I tried to reproduce that and I didn't succeed. That's why I asked you, what do I have to set, to get negative scale WITHOUT assigning negative values. note: @RobertInTpa didn't alter Diagram object !!!
Thanks
|
|
|
Product: Xtreme SuitePro (ActiveX) version 15.0.2
Platform: Windows XP (32bit) - SP 2 Language: Visual Basic 6.0 Zero replies is not an option.... |
|
|
|
|
Oleg
Admin Group
Joined: 21 May 2003 Location: United States Status: Offline Points: 11234 |
Post Options
Thanks(0)
Quote Reply
Posted: 22 February 2011 at 4:57am |
|
Right. This case I also can't reproduce.
@RobertInTpa: please try to catch it with our VB6 samples.
|
|
|
Oleg, Support Team
CODEJOCK SOFTWARE SOLUTIONS |
|
|
|
|
RobertInTpa
Groupie
Joined: 18 February 2011 Location: Tampa Status: Offline Points: 31 |
Post Options
Thanks(0)
Quote Reply
Posted: 22 February 2011 at 7:55am |
|
I don't use VB nor do I have it installed.
I am using Clarion 7.3 All I am doing is assigning values ... so I need to figure out what is going on. It is clearly showing the negative values. Do you have a debug option that will write to a text file as each control is set so you can see exactly what I have done? I'm just feeding it values.
|
|
|
Product: Active-X Chart Control 16, Active-X Calendar & Chart Controls
Platform: Windows 7 32-bit Language: Clarion 8.0 |
|
|
|
|
Aaron
Senior Member
Joined: 29 January 2008 Status: Offline Points: 2192 |
Post Options
Thanks(0)
Quote Reply
Posted: 22 February 2011 at 8:38am |
|
Hi, I created (very) basic test project:
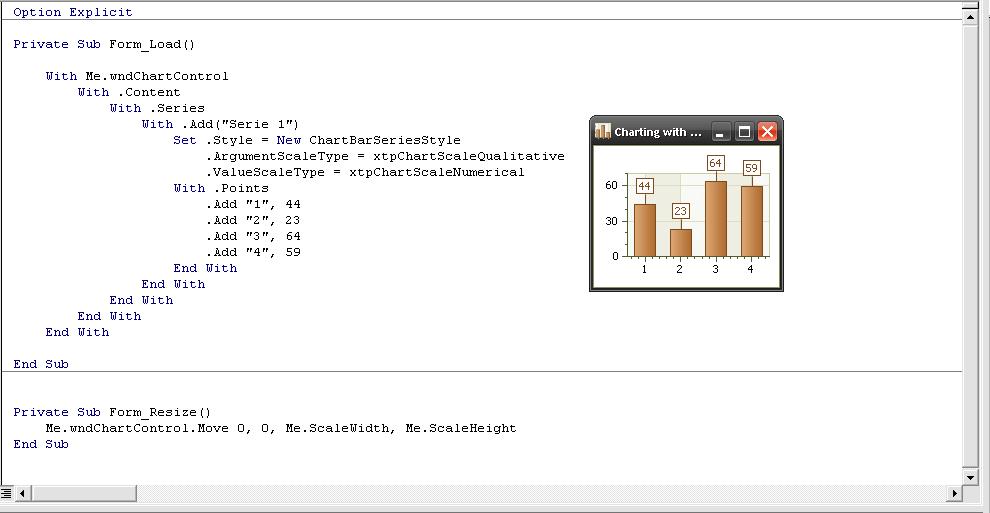
 The code in the images could be translated into your own language and should produce same output.
|
|
|
Product: Xtreme SuitePro (ActiveX) version 15.0.2
Platform: Windows XP (32bit) - SP 2 Language: Visual Basic 6.0 Zero replies is not an option.... |
|
|
|
|
RobertInTpa
Groupie
Joined: 18 February 2011 Location: Tampa Status: Offline Points: 31 |
Post Options
Thanks(0)
Quote Reply
Posted: 22 February 2011 at 8:54am |
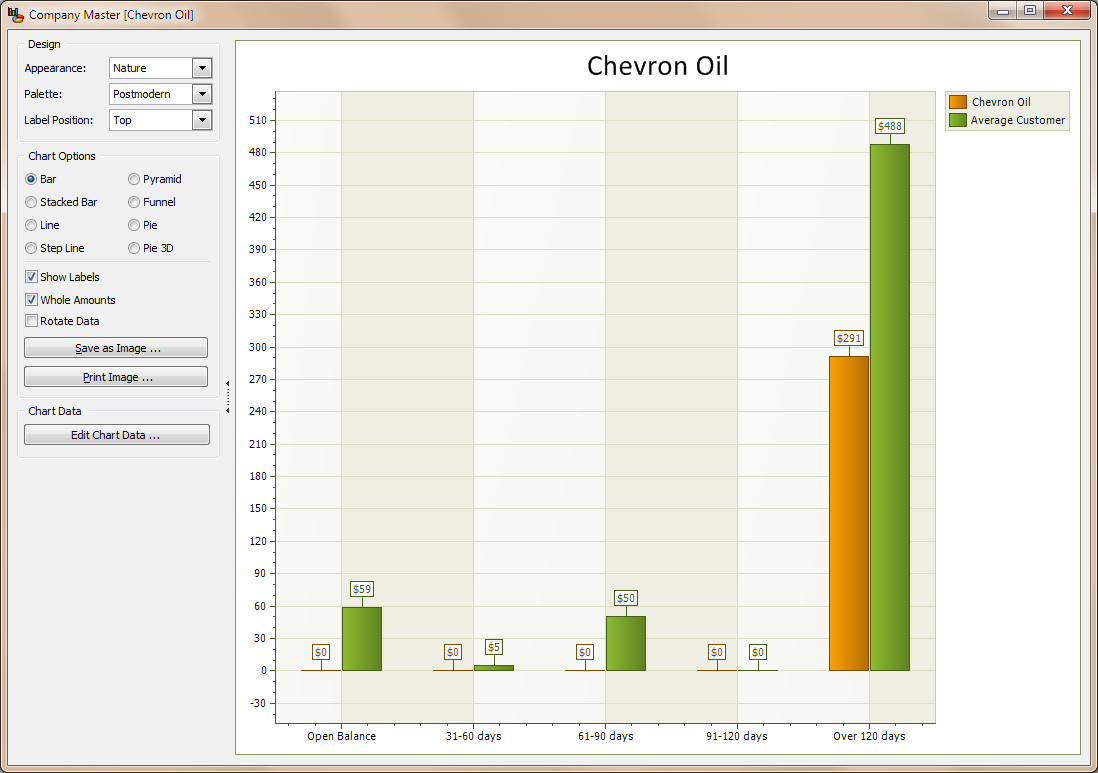
Hi, It is not all the time. Here's a graph that I did. I charted one customer. |
|
|
Product: Active-X Chart Control 16, Active-X Calendar & Chart Controls
Platform: Windows 7 32-bit Language: Clarion 8.0 |
|
|
|
|
RobertInTpa
Groupie
Joined: 18 February 2011 Location: Tampa Status: Offline Points: 31 |
Post Options
Thanks(0)
Quote Reply
Posted: 22 February 2011 at 8:58am |
|
Seems when I remove the 0.00 values, then it works properly.
When I add ONE person with a zero (0.00) value - then the negative axis appears. Seems like it is having an issue with zero's being added as data. that's when the issue happens.
|
|
|
Product: Active-X Chart Control 16, Active-X Calendar & Chart Controls
Platform: Windows 7 32-bit Language: Clarion 8.0 |
|
|
|
|
RobertInTpa
Groupie
Joined: 18 February 2011 Location: Tampa Status: Offline Points: 31 |
Post Options
Thanks(0)
Quote Reply
Posted: 22 February 2011 at 9:00am |
|
Yup! Just tested it.
select 'test',0 union all select 'test2',5 That shows negative values If I change to: select 'test',5 union all select 'test2',10 Then, it works fine. So -- seems a bug when zero is one of the values, it gets confused.
|
|
|
Product: Active-X Chart Control 16, Active-X Calendar & Chart Controls
Platform: Windows 7 32-bit Language: Clarion 8.0 |
|
|
|
|
Aaron
Senior Member
Joined: 29 January 2008 Status: Offline Points: 2192 |
Post Options
Thanks(0)
Quote Reply
Posted: 22 February 2011 at 9:28am |
|
Hi, An image doesn't say much... Show me how you created above chart. I don't have clarion but you can paste your code (the one that doesn't work properly) inhere and maybe I can see why...
|
|
|
Product: Xtreme SuitePro (ActiveX) version 15.0.2
Platform: Windows XP (32bit) - SP 2 Language: Visual Basic 6.0 Zero replies is not an option.... |
|
|
|
|
RobertInTpa
Groupie
Joined: 18 February 2011 Location: Tampa Status: Offline Points: 31 |
Post Options
Thanks(0)
Quote Reply
Posted: 22 February 2011 at 9:40am |
|
Try changing your values
add("1",0) add("2",111) See if it happens
|
|
|
Product: Active-X Chart Control 16, Active-X Calendar & Chart Controls
Platform: Windows 7 32-bit Language: Clarion 8.0 |
|
|
|
|
Aaron
Senior Member
Joined: 29 January 2008 Status: Offline Points: 2192 |
Post Options
Thanks(0)
Quote Reply
Posted: 22 February 2011 at 9:50am |
|
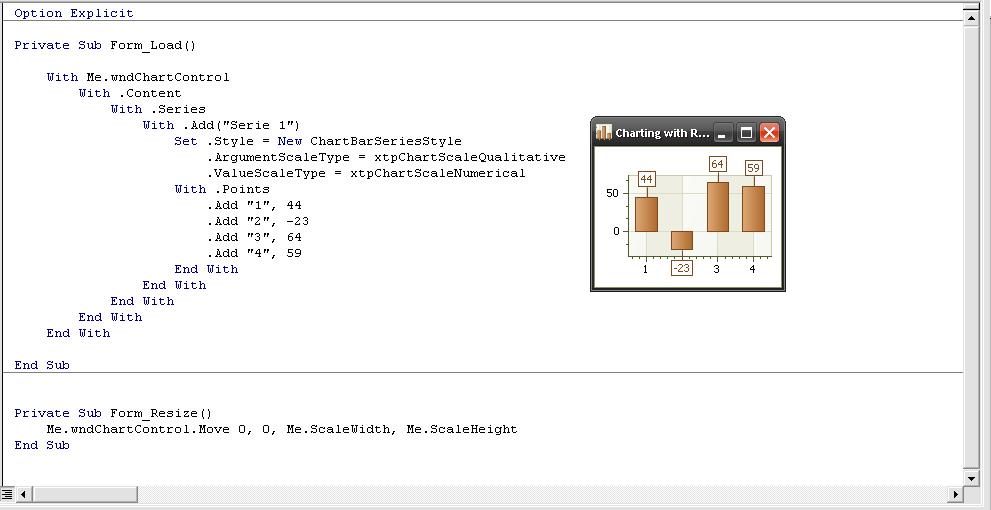
Hi, Yes, you are right !!! Y-axes show negative value when assigning zero to Point. Glad "we" solved this one... Now it's up to Oleg edit: The larger one of the other value gets, the larger the scale gets (negative)
Thanks
|
|
|
Product: Xtreme SuitePro (ActiveX) version 15.0.2
Platform: Windows XP (32bit) - SP 2 Language: Visual Basic 6.0 Zero replies is not an option.... |
|
|
|
|
RobertInTpa
Groupie
Joined: 18 February 2011 Location: Tampa Status: Offline Points: 31 |
Post Options
Thanks(0)
Quote Reply
Posted: 22 February 2011 at 9:52am |
|
That is what I was saying.
So ... how do we go about fixing it? How long does this take to be resolved normally?
|
|
|
Product: Active-X Chart Control 16, Active-X Calendar & Chart Controls
Platform: Windows 7 32-bit Language: Clarion 8.0 |
|
|
|
|
Aaron
Senior Member
Joined: 29 January 2008 Status: Offline Points: 2192 |
Post Options
Thanks(0)
Quote Reply
Posted: 22 February 2011 at 10:36am |
|
Hi, Let's hope in this release, I'm not sure but they are preparing new release this week so it will be surely after next release
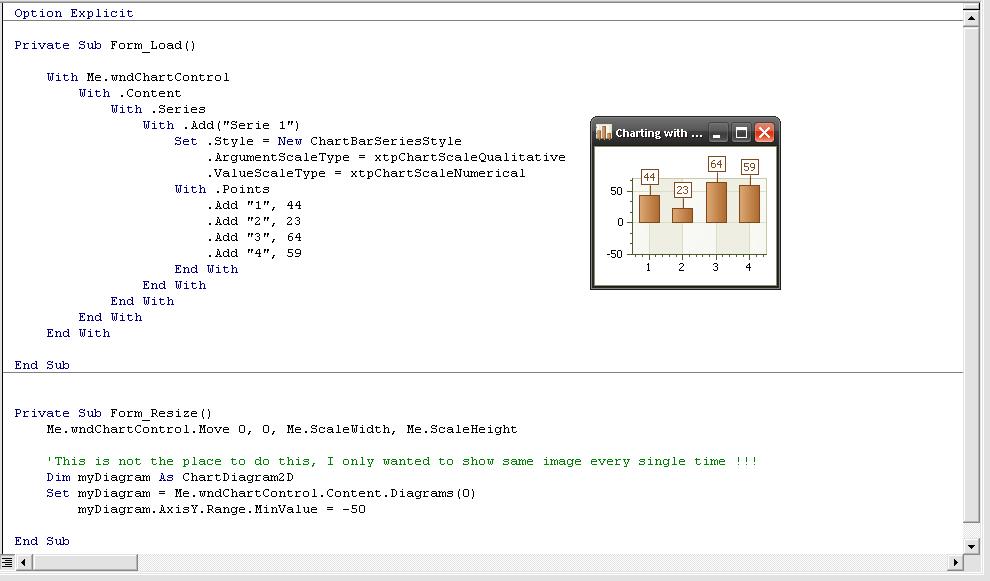
If you desperately need this you could set:
Dim myDiagram As ChartDiagram2D
Set myDiagram = Me.wndChartControl.Content.Diagrams(0) 'Set diagram to current diagram myDiagram.AxisY.Range.MinValue = 0 'Set minimum value for Y axes This way it shows only positive scale.
|
|
|
Product: Xtreme SuitePro (ActiveX) version 15.0.2
Platform: Windows XP (32bit) - SP 2 Language: Visual Basic 6.0 Zero replies is not an option.... |
|
|
|
|
RobertInTpa
Groupie
Joined: 18 February 2011 Location: Tampa Status: Offline Points: 31 |
Post Options
Thanks(0)
Quote Reply
Posted: 22 February 2011 at 10:37am |
|
Thank you very much.
I will keep my fingers crossed.
|
|
|
Product: Active-X Chart Control 16, Active-X Calendar & Chart Controls
Platform: Windows 7 32-bit Language: Clarion 8.0 |
|
|
|
|
Aaron
Senior Member
Joined: 29 January 2008 Status: Offline Points: 2192 |
Post Options
Thanks(0)
Quote Reply
Posted: 22 February 2011 at 10:45am |
|
Hi, I don't know if you have active subscription? If you run into another problem/bug you are able to open a ticket https://support.codejock.com |
|
|
Product: Xtreme SuitePro (ActiveX) version 15.0.2
Platform: Windows XP (32bit) - SP 2 Language: Visual Basic 6.0 Zero replies is not an option.... |
|
|
|
|
Oleg
Admin Group
Joined: 21 May 2003 Location: United States Status: Offline Points: 11234 |
Post Options
Thanks(0)
Quote Reply
Posted: 22 February 2011 at 12:21pm |
|
Thanks, will check it. I sure its standard thing with "negative zero" think as workaround for now try set as very small value 0.0000001.
Fixing it for 15.0.2
|
|
|
Oleg, Support Team
CODEJOCK SOFTWARE SOLUTIONS |
|
|
|
|
RobertInTpa
Groupie
Joined: 18 February 2011 Location: Tampa Status: Offline Points: 31 |
Post Options
Thanks(0)
Quote Reply
Posted: 22 February 2011 at 4:12pm |
|
Thanks OLEG! :-)
|
|
|
Product: Active-X Chart Control 16, Active-X Calendar & Chart Controls
Platform: Windows 7 32-bit Language: Clarion 8.0 |
|
|
|
|
Xander75
Senior Member

Joined: 26 April 2007 Status: Offline Points: 353 |
Post Options
Thanks(0)
Quote Reply
Posted: 23 February 2011 at 9:32am |
|
Hi,
I had noticed this issue too but you beat me to it! I am glad Oleg is on the case  |
|
|
Product: Xtreme SuitePro (ActiveX) v15.3.1
Platform: Windows 7 64-bit (SP1) Professional Edition Languages: C#.Net using Visual Studio 2012 & Visual Basic 6.0 (SP6) |
|
|
|
|
Xander75
Senior Member
Joined: 26 April 2007 Status: Offline Points: 353 |
Post Options
Thanks(0)
Quote Reply
Posted: 24 February 2011 at 5:05am |
|
Hi,
Just to say I have noticed an issue when performing a Print or Print Preview. I set the Diagram.AxisY.Range.MinValue = "0.0000001" as a workaround, however on Print or Print Preview the negative values seem to appear once again! |
|
|
Product: Xtreme SuitePro (ActiveX) v15.3.1
Platform: Windows 7 64-bit (SP1) Professional Edition Languages: C#.Net using Visual Studio 2012 & Visual Basic 6.0 (SP6) |
|
|
|
|
Post Reply
|
|
 Tweet
Tweet
|
| Forum Jump | Forum Permissions You cannot post new topics in this forum You cannot reply to topics in this forum You cannot delete your posts in this forum You cannot edit your posts in this forum You cannot create polls in this forum You cannot vote in polls in this forum |


 Topic Options
 oleg wrote: