Path Data Xaml |
Post Reply 
|
| Author | |
jpbro 
Senior Member 
Joined: 12 January 2007 Status: Offline Points: 1357 |
 Post Options Post Options
") Thanks(0) Thanks(0)
 Quote Reply Quote Reply
 Topic: Path Data Xaml Topic: Path Data XamlPosted: 08 October 2008 at 6:19pm |
|
Does anyone know where to get good information on the Path element Data attribute? I've been looking at the CJ chart samples, and the Pie chart confounds me:
Draws a pie slice, but I'm not sure how...How would I convert a percentage (i.e 10%) into a slice that represents that percentage? Thanks in advance for any help. |
|
|
Product: Xtreme SuitePro (ActiveX) version 16.2.6
Platform: Windows XP - SP3 Language: Visual Basic 6.0 SP6 |
|
 |
|
|
jpbro
Senior Member
Joined: 12 January 2007 Status: Offline Points: 1357 |
Post Options
Thanks(0)
Quote Reply
Posted: 08 October 2008 at 9:23pm |
|
I found the MS site on the Path Data mini-language. If anyone else is interested it is here:
http://msdn.microsoft.com/en-us/library/cc189041(VS.95).aspx#abouthisdocument I now understand that M is MoveTo, L is LineTo, S is Smooth Cubic Bezier Curve, and Z closes the path. I understand how to use them basically. What I don't understand is how to mathematically convert something like a percentage or angle to the correct values to accurately represent a pie slice (really it's the S value that I have no idea how to compute). Most of the sample code I have found uses the A (Elliptical Arc) command, and it seems that CJ markup doesn't support this. Anybody have any experience with this? |
|
|
Product: Xtreme SuitePro (ActiveX) version 16.2.6
Platform: Windows XP - SP3 Language: Visual Basic 6.0 SP6 |
|
|
|
|
jpbro
Senior Member
Joined: 12 January 2007 Status: Offline Points: 1357 |
Post Options
Thanks(0)
Quote Reply
Posted: 09 October 2008 at 12:03am |
|
Okay, *some* progress...
Here's a sample that does "okay" on evenly divided slices, but gets weird when the slices have different values: uploads/20081008_235828_XamlPieChart.zip These screenshots illustrate the point I'm at now: 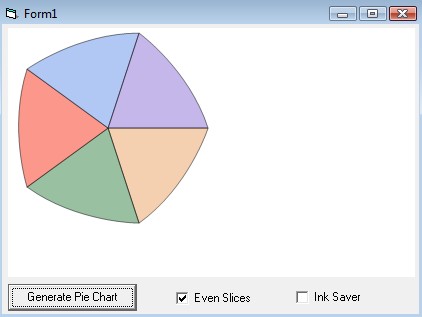 (EVEN SLICE PERCENTAGES: 20%) 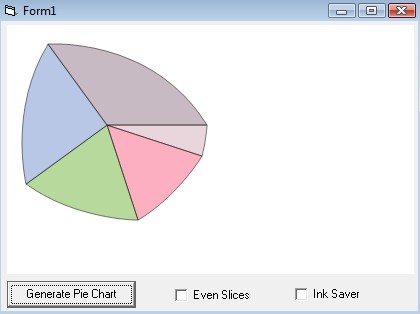 (VARIOUS SLICE PERCENTAGES: 5,15,20,25,35%) I will be the first to admit that geometric calculations are not my strong point, so if anybody has an idea of what I am doing wrong, or how to get a better result, I would appreciate the input. I'll be happy to post a good reusable class when the results are good in return. Thanks a lot. |
|
|
Product: Xtreme SuitePro (ActiveX) version 16.2.6
Platform: Windows XP - SP3 Language: Visual Basic 6.0 SP6 |
|
|
|
|
Oleg
Senior Member
Joined: 21 May 2003 Location: United States Status: Offline Points: 11234 |
Post Options
Thanks(0)
Quote Reply
Posted: 09 October 2008 at 2:47am |
|
|
|
jpbro
Senior Member
Joined: 12 January 2007 Status: Offline Points: 1357 |
Post Options
Thanks(0)
Quote Reply
Posted: 09 October 2008 at 11:35am |
|
Hi Oleg,
I've seen the chart sample (in fact that's where I got the Path Data code that I showed in the first message). What I don't understand is what math is required to calculate the required values to put into the S portion of the mini-language. For example, If I want to draw the first pie slice (10%), how do I know what S values are required to accurately draw the arc/curve to appear as 10% or 36 degrees of a circle? In any case, I know it's not your job to teach me math, or XAML for that matter, I was just hoping somebody had some insights on this. |
|
|
Product: Xtreme SuitePro (ActiveX) version 16.2.6
Platform: Windows XP - SP3 Language: Visual Basic 6.0 SP6 |
|
|
|
|
jpbro
Senior Member
Joined: 12 January 2007 Status: Offline Points: 1357 |
Post Options
Thanks(0)
Quote Reply
Posted: 09 October 2008 at 11:44am |
|
I've created a pie chart with another program using the same values as my "sloppy" XAML chart (5%, 15%, 20%, 25%, 35%), and then overlayed my chart over that chart:
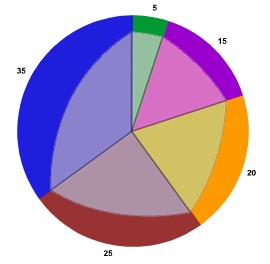 As you can see, my math for the L values is correct (the lines extending from the center of the pie chart to the radius match the other pie chart, so the basic representation is correct). The problem is obviously with my calculations for the S values. Right now I am picking a point halfway between L values, but this is obviously incorrect. |
|
|
Product: Xtreme SuitePro (ActiveX) version 16.2.6
Platform: Windows XP - SP3 Language: Visual Basic 6.0 SP6 |
|
|
|
|
jpbro
Senior Member
Joined: 12 January 2007 Status: Offline Points: 1357 |
Post Options
Thanks(0)
Quote Reply
Posted: 09 October 2008 at 11:51pm |
|
I found this interesting PDF that seems to indicate a solution to the problem:
http://itc.ktu.lt/itc354/Riskus354.pdf Fittingly titled Approximation of a Cubic Bezier Curve by Circular Arcs and Vice Versa. Unfortunately, the cubic bezier curve has four control points as far as the PDF is concerned, but the Path Data mini-language cubic bezier curve only seems to accept three points, so I'm at a bit of a loss in terms of how to proceed... I've tried converting the formulas in the document to VB code, but unfortunately I haven't had much success yet (at generating a pie slice at least, but I have made some pretty pictures ;) ). Anyone care to take a stab at it? |
|
|
Product: Xtreme SuitePro (ActiveX) version 16.2.6
Platform: Windows XP - SP3 Language: Visual Basic 6.0 SP6 |
|
|
|
|
Oleg
Senior Member
Joined: 21 May 2003 Location: United States Status: Offline Points: 11234 |
Post Options
Thanks(0)
Quote Reply
Posted: 10 October 2008 at 2:21am |
|
Hi,
Yes, we need to sit and implement Arc using Bizier for future version - at least standard XAML also do same. Just need to prepare for such kind of Math. :-( Pie chart will be much easy to implement with 'a' tag.
|
|
|
Oleg, Support Team
CODEJOCK SOFTWARE SOLUTIONS |
|
|
|
|
jpbro
Senior Member
Joined: 12 January 2007 Status: Offline Points: 1357 |
Post Options
Thanks(0)
Quote Reply
Posted: 10 October 2008 at 11:33am |
|
Hi Oleg,
Thanks for the reply. I will probably hold off on the pie chart until the Arc bezier is implemented then, as the Cubic bezier stuff is blowing my mind ;) |
|
|
Product: Xtreme SuitePro (ActiveX) version 16.2.6
Platform: Windows XP - SP3 Language: Visual Basic 6.0 SP6 |
|
|
|
|
Post Reply
|
|
 Tweet
Tweet
|
| Forum Jump | Forum Permissions You cannot post new topics in this forum You cannot reply to topics in this forum You cannot delete your posts in this forum You cannot edit your posts in this forum You cannot create polls in this forum You cannot vote in polls in this forum |


 Topic Options