
 |
UPDATED VB6 Line & Pie Chart Demo with MarkupLabel |
Post Reply 
|
| Author | ||||
jpbro 
Senior Member 
Joined: 12 January 2007 Status: Offline Points: 1355 |
 Post Options Post Options
 Thanks(0) Thanks(0)
 Quote Quote  Reply Reply
 Topic: UPDATED VB6 Line & Pie Chart Demo with MarkupLabel Topic: UPDATED VB6 Line & Pie Chart Demo with MarkupLabelPosted: 04 October 2008 at 12:01am |
|||
|
I was looking at the XAML chart sample, and I liked what I saw - the only problem was that the XAML was pretty specific to a certain dataset, and I wanted to see what it would take to genericize it.
This is my first attempt at making a generic line chart class that should make it easier to generate a XAML chart for a number of different scenarios. Feel free to use it, modify it and (especially!) submit improvements or ideas :) NEWEST VERSION: uploads/20090905_064900_XamlChart13a.zip Some features: Object model, no XAML knowledge required Multiple series, each series supports its own line color & thickness Different numeric formatting for X and Y axes Definable Min/Max Axis Values Customizable title text, font & size A few colour options This is my first run through, so there are quite likely to be bugs and/or unusual behaviours. If you notice anything, reports would be appreciated. Enjoy! Screenshot: 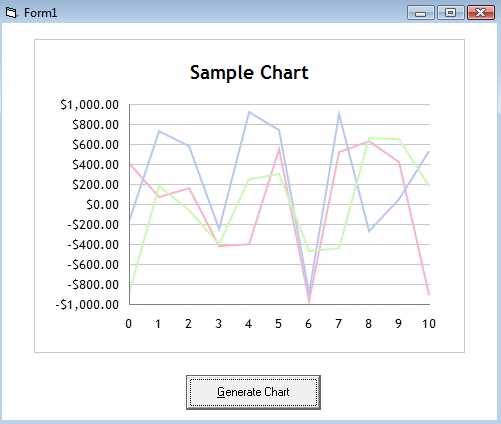 |
||||
|
Product: Xtreme SuitePro (ActiveX) version 16.2.6
Platform: Windows XP - SP3 Language: Visual Basic 6.0 SP6 |
||||
 |
||||
jpbro 
Senior Member 
Joined: 12 January 2007 Status: Offline Points: 1355 |
 Post Options Post Options
 Thanks(0) Thanks(0)
 Quote Quote  Reply Reply
 Posted: 05 October 2008 at 11:16pm Posted: 05 October 2008 at 11:16pm |
|||
|
I've updated the chart demo with a number of new features. You can now customize:
1) Chart Page backcolor 2) Chart Area border color, thickness and roundness 3) Chart area background color 4) Data area background color 5) Legend 6) Title font & color 7) Axis label color 8) Axis ticks There are some known bugs around the Axis ticks when the data area border thickness > 1. Screenshot: 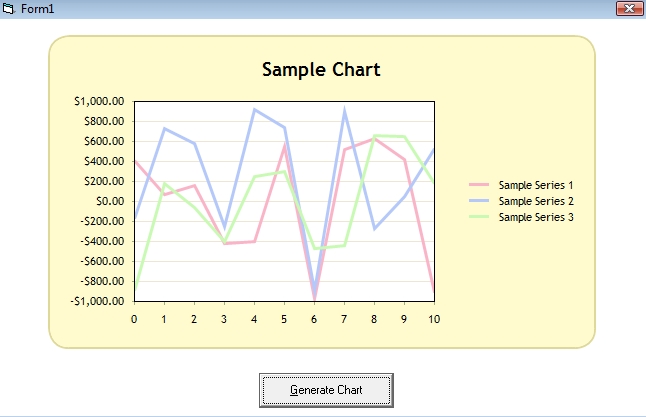 |
||||
|
Product: Xtreme SuitePro (ActiveX) version 16.2.6
Platform: Windows XP - SP3 Language: Visual Basic 6.0 SP6 |
||||
 |
||||
Oleg 
Senior Member 
Joined: 21 May 2003 Location: United States Status: Offline Points: 11234 |
 Post Options Post Options
 Thanks(0) Thanks(0)
 Quote Quote  Reply Reply
 Posted: 06 October 2008 at 3:13am Posted: 06 October 2008 at 3:13am |
|||
|
Thank you, Jason, Its so great we have customers like you :-)
|
||||
|
Oleg, Support Team
CODEJOCK SOFTWARE SOLUTIONS |
||||
 |
||||
jpbro 
Senior Member 
Joined: 12 January 2007 Status: Offline Points: 1355 |
 Post Options Post Options
 Thanks(0) Thanks(0)
 Quote Quote  Reply Reply
 Posted: 07 October 2008 at 11:41pm Posted: 07 October 2008 at 11:41pm |
|||
|
Hi Oleg, glad you like the demo. It is great we have component developer's like you to make it possible!
UPDATED SOURCE IN TOP POST It includes a number of bug fixes and output improvements. I've also added more color/transparency, font, and margin/padding properties. Lastly, I've added an event that allows you to customize any axis step label before it is drawn. The demo is getting pretty close to completing the requirements for my project, so I'll likely move now on unless anyone has any requests/suggestions. Latest screenshot: 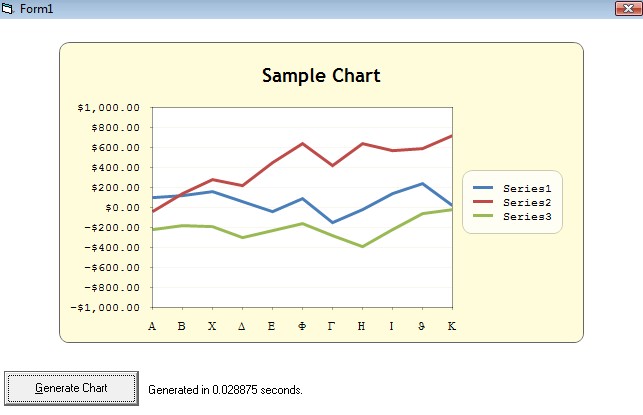 |
||||
|
Product: Xtreme SuitePro (ActiveX) version 16.2.6
Platform: Windows XP - SP3 Language: Visual Basic 6.0 SP6 |
||||
 |
||||
jpbro 
Senior Member 
Joined: 12 January 2007 Status: Offline Points: 1355 |
 Post Options Post Options
 Thanks(0) Thanks(0)
 Quote Quote  Reply Reply
 Posted: 12 October 2008 at 11:13pm Posted: 12 October 2008 at 11:13pm |
|||
|
After messing around with bezier curves, and trying to get pie slices to be rendered accurately, I finally thought of a hacky way to accomplish a pie chart in XAML. Why not just draw the slices out beyond the edge of the circle, and then overlay a circle over top of that drawing to result in a perfect pie chart?
I've updated my line chart demo to include a pie chart demo, so now we have basic access to two kinds of charts. Things still to do: 1) Add % and/or Amounts labels to chart and/or Legend 2) Add better comments to code, and tidy things up a bit 3) Any requests?? UPDATED SOURCE IN MY TOP POST Here's a screenshot: 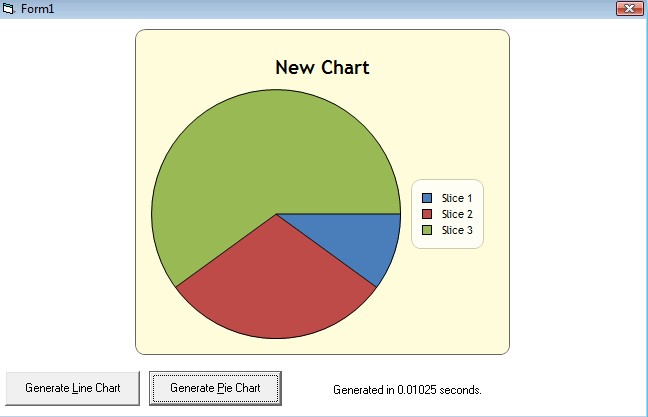 |
||||
|
Product: Xtreme SuitePro (ActiveX) version 16.2.6
Platform: Windows XP - SP3 Language: Visual Basic 6.0 SP6 |
||||
 |
||||
Oleg 
Senior Member 
Joined: 21 May 2003 Location: United States Status: Offline Points: 11234 |
 Post Options Post Options
 Thanks(0) Thanks(0)
 Quote Quote  Reply Reply
 Posted: 13 October 2008 at 7:30am Posted: 13 October 2008 at 7:30am |
|||
|
Hi,
Thanks, another great code :-)
and nice hack! Had to save it to file and played 10 minutes to understand how it works :) |
||||
|
Oleg, Support Team
CODEJOCK SOFTWARE SOLUTIONS |
||||
 |
||||
jpbro 
Senior Member 
Joined: 12 January 2007 Status: Offline Points: 1355 |
 Post Options Post Options
 Thanks(0) Thanks(0)
 Quote Quote  Reply Reply
 Posted: 13 October 2008 at 11:40am Posted: 13 October 2008 at 11:40am |
|||
|
Thanks Oleg! I knew I should have commented the XAML portions a bit more thoroughly :)
For anyone that's reading, or wondering how it works, here's the breakdown. It finally dawned on me that it should be fairly easy (although admittedly less correct) to draw a circle around a square "pie" chart in order to get the more familiar appearance. The first step was to draw the pie chart in a box instead of a circle. The box has the diameter of the finished chart, and the slices extend to all of the edges of the box. The XAML might look something like this:
The result: 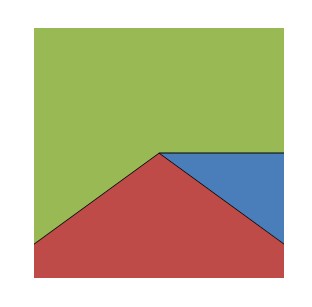 Some important parts of the markup are ClipToBounds='True' in the Border tag. This prevents the slices from drawing outside of the square border. Also, you may have noticed that the first slice (Path elements) doesn't have a Stroke, and only the last slice has a close shape (Z) command. This is so that there are no overlapping stroke lines for the slices which can cause inconsistent colors or thicknesses (particularly when using transparency). The next step is to draw the circle around the square pie. This turns out to be trickier than expected for a couple of reasons: 1) The Ellipse command doesn't seem to have an ability to fill or stroke OUTSIDE its borders, only inside. 2) I wanted to be able to have a page color and chart background colour, both with transparency, so we have to draw a number of ellipses to make sure our colour output is correct for the mask. Here's the XAML:
The first three ellipses are there to mask out the unwanted portions of the square pie, and the fourth ellipse is to draw a border around the new round pie. By offseting the mask by the appropriate Left & Right values for the size of the final pie, and then setting a very high StrokeThickness, we end up with the correctly sized round pie. First we draw a White ellipse to erase the unwanted portions of the square pie. Then we draw another ellipse of the same size as the previous one in the page background colour and transparency. Next we draw another ellipse of the same size using the chart background colour and transparency. These three steps ensure that the final colour of the mask matches the outer border we will draw for the chart. Finally, we draw an ellipse that matches the diameter of the final chart with a StrokeThickness of 1 to draw a border around the chart. The XAML so far:
Thanks to the ClipToBounds='True' attribute of the parent Border element, the gigantic ellipses do not get drawn outside of the Border boundary. Putting it all together with background colours, we get the following XAML:
All of the above is easily customizable via the properties available in the CChartPie class in my demo. No XAML knowledge required. |
||||
|
Product: Xtreme SuitePro (ActiveX) version 16.2.6
Platform: Windows XP - SP3 Language: Visual Basic 6.0 SP6 |
||||
 |
||||
jpbro 
Senior Member 
Joined: 12 January 2007 Status: Offline Points: 1355 |
 Post Options Post Options
 Thanks(0) Thanks(0)
 Quote Quote  Reply Reply
 Posted: 13 October 2008 at 11:28pm Posted: 13 October 2008 at 11:28pm |
|||
|
Update demo with some new features for Pie Charts:
1) Doughnut mode 2) Automatic "Other" slice rendering based on a user-defined threshold. Also includes some bug fixes. GET THE UPDATED SOURCE CODE IN MY TOP POST Screenshot: 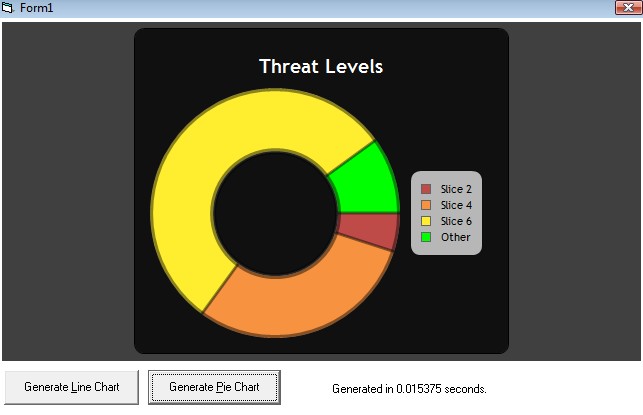 |
||||
|
Product: Xtreme SuitePro (ActiveX) version 16.2.6
Platform: Windows XP - SP3 Language: Visual Basic 6.0 SP6 |
||||
 |
||||
Oleg 
Senior Member 
Joined: 21 May 2003 Location: United States Status: Offline Points: 11234 |
 Post Options Post Options
 Thanks(0) Thanks(0)
 Quote Quote  Reply Reply
 Posted: 14 October 2008 at 8:36am Posted: 14 October 2008 at 8:36am |
|||
|
Looks great :)
|
||||
|
Oleg, Support Team
CODEJOCK SOFTWARE SOLUTIONS |
||||
 |
||||
Moritz 
Groupie 
Joined: 22 December 2005 Location: Germany Status: Offline Points: 11 |
 Post Options Post Options
 Thanks(0) Thanks(0)
 Quote Quote  Reply Reply
 Posted: 19 October 2008 at 4:48pm Posted: 19 October 2008 at 4:48pm |
|||
|
Hi those charting samples look great! It would be really nice to have such classes in c++ mfc too. Oleg I think the charting feature is an important feature for codejock customers, because for c++ mfc there is no compareable toolkit which supports a good look and easy charting control. D*ndas Charting is only available with a .Net embedding which is a bad solution for native code. Greetings, keep the good work up... Moritz
|
||||
 |
||||
jpbro 
Senior Member 
Joined: 12 January 2007 Status: Offline Points: 1355 |
 Post Options Post Options
 Thanks(0) Thanks(0)
 Quote Quote  Reply Reply
 Posted: 20 October 2008 at 6:35pm Posted: 20 October 2008 at 6:35pm |
|||
|
Thanks Oleg!
I have one more chart type demo for everyone to try - A Single series Bar chart: 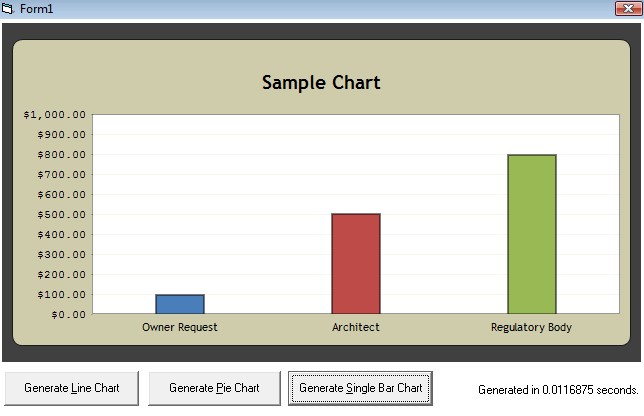 Unlike the Line Chart, I was able to use the UniformGrid object to get the chart to take up the available width of the MarkupLabel control. This works for the Bar chart because we don't need to know where to put lines on the X axis (we just center the bars in a UniformGrid that matches the Axis captions UniformGrid). I'm trying to come up with a way to do this for the Line chart as well, so we'll see how far I get. I've also updated all of the demos to use the new CJ Markup objects wherever possible instead of using XAML strings. In some cases the obejct don't have the required properties yet, so for these I use the Parse method of the MarkupContext object to get the job done. Hopefully these experiments will help CJ add all of the required objects/methods/properties/etc... I'm not sure if anyone even knows this sub-sub forum is here  , but if you're out there and trying this code out, then comments are always welcome! , but if you're out there and trying this code out, then comments are always welcome! |
||||
|
Product: Xtreme SuitePro (ActiveX) version 16.2.6
Platform: Windows XP - SP3 Language: Visual Basic 6.0 SP6 |
||||
 |
||||
ABuenger 
Newbie 

Joined: 02 February 2006 Status: Offline Points: 1075 |
 Post Options Post Options
 Thanks(0) Thanks(0)
 Quote Quote  Reply Reply
 Posted: 21 October 2008 at 7:44am Posted: 21 October 2008 at 7:44am |
|||
|
Great samples! A charting control based on XAML templates would be cool!
|
||||
|
Codejock support
|
||||
 |
||||
jpbro 
Senior Member 
Joined: 12 January 2007 Status: Offline Points: 1355 |
 Post Options Post Options
 Thanks(0) Thanks(0)
 Quote Quote  Reply Reply
 Posted: 21 October 2008 at 10:49am Posted: 21 October 2008 at 10:49am |
|||
|
Hi Moritz & ABuenger, thanks for the kind words :) I wasn't sure if anybody was reading...
A supported chart control by CJ (based on Markup) would be very cool indeed :) As for C++/MFC classes, unfortunately I wouldn't have the time to go this route myself as I am using these demos as a basis for some other code I am working on that is in VB6 (and is eating up most of my time). Sorry! I should also add (in case I didn't mention it anywhere) that you are free to use the code in any way you want, so enjoy! |
||||
|
Product: Xtreme SuitePro (ActiveX) version 16.2.6
Platform: Windows XP - SP3 Language: Visual Basic 6.0 SP6 |
||||
 |
||||
ABuenger 
Newbie 

Joined: 02 February 2006 Status: Offline Points: 1075 |
 Post Options Post Options
 Thanks(0) Thanks(0)
 Quote Quote  Reply Reply
 Posted: 21 October 2008 at 4:39pm Posted: 21 October 2008 at 4:39pm |
|||
I'm only afraid that a chart control based on markup could be too slow for realtime charts. But it would be nice if you could use XAML templates to define the layout of the chart. |
||||
|
Codejock support
|
||||
 |
||||
jpbro 
Senior Member 
Joined: 12 January 2007 Status: Offline Points: 1355 |
 Post Options Post Options
 Thanks(0) Thanks(0)
 Quote Quote  Reply Reply
 Posted: 21 October 2008 at 5:09pm Posted: 21 October 2008 at 5:09pm |
|||
|
Based on the chart demos, I think that markup could be fast enough for real-time applications (depending on how fast your polling needed to be). If you notice from the screenshots, those demos took .01 to .03 seconds to generate and render from scratch. The first render would take the longest, but updates could theoretically be made quicker by storing the dynamic markup objects in variables and then changing the required values only (instead of re-generating/rendering the entire XAML as required using strings).
I'll see about doing a dynamic/real-time (or at least as real-time as VB gets) demo to see what kind of speeds I can get... Lastly, I forgot to mention that the code in the latest demos requires the most recent beta build of the MarkupLabel control otherwise certain elements will not render properly. |
||||
|
Product: Xtreme SuitePro (ActiveX) version 16.2.6
Platform: Windows XP - SP3 Language: Visual Basic 6.0 SP6 |
||||
 |
||||
Aaron 
Senior Member 
Joined: 29 January 2008 Status: Offline Points: 2192 |
 Post Options Post Options
 Thanks(0) Thanks(0)
 Quote Quote  Reply Reply
 Posted: 24 October 2008 at 5:54am Posted: 24 October 2008 at 5:54am |
|||
|
Hi Jason,
You are the man. I think you need to change your middle name into XAML
 Jason "XAML or Markup" Brown hehehe. This is really great. Jason "XAML or Markup" Brown hehehe. This is really great. Thanks a lot
|
||||
|
Product: Xtreme SuitePro (ActiveX) version 15.0.2
Platform: Windows XP (32bit) - SP 2 Language: Visual Basic 6.0 Zero replies is not an option.... |
||||
 |
||||
jpbro 
Senior Member 
Joined: 12 January 2007 Status: Offline Points: 1355 |
 Post Options Post Options
 Thanks(0) Thanks(0)
 Quote Quote  Reply Reply
 Posted: 24 October 2008 at 6:06pm Posted: 24 October 2008 at 6:06pm |
|||
 Thanks Aaron, glad you like the demos, and I hope you can find some use for the classes! Thanks Aaron, glad you like the demos, and I hope you can find some use for the classes!
|
||||
|
Product: Xtreme SuitePro (ActiveX) version 16.2.6
Platform: Windows XP - SP3 Language: Visual Basic 6.0 SP6 |
||||
 |
||||
jpbro 
Senior Member 
Joined: 12 January 2007 Status: Offline Points: 1355 |
 Post Options Post Options
 Thanks(0) Thanks(0)
 Quote Quote  Reply Reply
 Posted: 29 October 2008 at 8:37pm Posted: 29 October 2008 at 8:37pm |
|||
|
Updated source, mostly minor bug fixes & support for 100% transparent colour:
UPDATED SOURCE IN MY TOP POST |
||||
|
Product: Xtreme SuitePro (ActiveX) version 16.2.6
Platform: Windows XP - SP3 Language: Visual Basic 6.0 SP6 |
||||
 |
||||
Aaron 
Senior Member 
Joined: 29 January 2008 Status: Offline Points: 2192 |
 Post Options Post Options
 Thanks(0) Thanks(0)
 Quote Quote  Reply Reply
 Posted: 30 October 2008 at 3:30pm Posted: 30 October 2008 at 3:30pm |
|||
|
Hi Jason,
Which of the charts do have transparency? I can't generate PieChart because of missing properties, think I don't have last version of Beta
 Thanks a lot for this great code and keep up the good work
 |
||||
|
Product: Xtreme SuitePro (ActiveX) version 15.0.2
Platform: Windows XP (32bit) - SP 2 Language: Visual Basic 6.0 Zero replies is not an option.... |
||||
 |
||||
jpbro 
Senior Member 
Joined: 12 January 2007 Status: Offline Points: 1355 |
 Post Options Post Options
 Thanks(0) Thanks(0)
 Quote Quote  Reply Reply
 Posted: 30 October 2008 at 3:38pm Posted: 30 October 2008 at 3:38pm |
|||
|
Almost every element that has a BackColor, BorderColor, FillColor etc... also has a related BackTransparencyPercent, BorderTransparencyPercent etc... property. That being said, I may have missed some, so if you notice any just tell me and I will remedy the situation.
There is a bug in earlier versions of the MarkupLabel beta that prevents transparency from working when using the MarkupSolidBrush object (the latest demos use the Markup objects instead of XAML strings, see this thread for more info on the transparency problem: https://forum.codejock.com/forum_posts.asp?TID=12391). I think you have to request the latest beta from support@codejock.com in order for the transparency to work properly. Also, text does not currently support transparency at all, so there should be no TransparencyPercent properties for any Text/Font properties. If they exists, they will not work and shouldn't be there. |
||||
|
Product: Xtreme SuitePro (ActiveX) version 16.2.6
Platform: Windows XP - SP3 Language: Visual Basic 6.0 SP6 |
||||
 |
||||
jpbro 
Senior Member 
Joined: 12 January 2007 Status: Offline Points: 1355 |
 Post Options Post Options
 Thanks(0) Thanks(0)
 Quote Quote  Reply Reply
 Posted: 30 October 2008 at 5:15pm Posted: 30 October 2008 at 5:15pm |
|||
|
I've just updated the demo again to include a CTransparentColor class that makes it cleaner to manage the color and transparency of chart elements that support transparency. This will require the latest beta to work properly.
Also the charts now respect the Title border & background colors, margins & padding. SEE TOP POST FOR MOST RECENT UPDATE |
||||
|
Product: Xtreme SuitePro (ActiveX) version 16.2.6
Platform: Windows XP - SP3 Language: Visual Basic 6.0 SP6 |
||||
 |
||||
jpbro 
Senior Member 
Joined: 12 January 2007 Status: Offline Points: 1355 |
 Post Options Post Options
 Thanks(0) Thanks(0)
 Quote Quote  Reply Reply
 Posted: 30 March 2009 at 12:15pm Posted: 30 March 2009 at 12:15pm |
|||
|
Updated for Version 13.0.0:
uploads/20090330_121512_XamlChart13.zip If you have a different version you can change the value of the mc_MarkupLabelVersion string in the modXaml module. |
||||
|
Product: Xtreme SuitePro (ActiveX) version 16.2.6
Platform: Windows XP - SP3 Language: Visual Basic 6.0 SP6 |
||||
 |
||||
chrisABC 
Senior Member 
Joined: 05 June 2008 Status: Offline Points: 258 |
 Post Options Post Options
 Thanks(0) Thanks(0)
 Quote Quote  Reply Reply
 Posted: 03 September 2009 at 3:19pm Posted: 03 September 2009 at 3:19pm |
|||
|
Thank you for the Chart demo using XAML.
Excellent code and very helpful remarks throughout. Please CJ could you write your samples as nicely as this :-) As well as producing Charts, this demo contains some great VB6 programming examples. Very useful. |
||||
|
Chris (Manchester, UK) -- www.abc6.co.uk ---- Using CodeJock ActiveX Suite 13.1.0 with Windows8, VB6 SP6
|
||||
 |
||||
jpbro 
Senior Member 
Joined: 12 January 2007 Status: Offline Points: 1355 |
 Post Options Post Options
 Thanks(0) Thanks(0)
 Quote Quote  Reply Reply
 Posted: 03 September 2009 at 9:34pm Posted: 03 September 2009 at 9:34pm |
|||
|
Hi Chris,
Thanks a lot for the compliments, and I am glad that you found the code useful/helpful! |
||||
|
Product: Xtreme SuitePro (ActiveX) version 16.2.6
Platform: Windows XP - SP3 Language: Visual Basic 6.0 SP6 |
||||
 |
||||
jpbro 
Senior Member 
Joined: 12 January 2007 Status: Offline Points: 1355 |
 Post Options Post Options
 Thanks(0) Thanks(0)
 Quote Quote  Reply Reply
 Posted: 05 September 2009 at 6:54am Posted: 05 September 2009 at 6:54am |
|||
|
chrisABC reported a problem with the previous compiled source when run on machines that don't have the CJ controls installed with the licenses included (that is, non-developer machines). I've changed the way I reference the markup label control as follows:
https://forum.codejock.com/forum_posts.asp?TID=15117&PID=52799#52799 You can get the new source in the TOP post in this thread. Special thanks to chrisABC for reporting the problem and testing the solution. |
||||
|
Product: Xtreme SuitePro (ActiveX) version 16.2.6
Platform: Windows XP - SP3 Language: Visual Basic 6.0 SP6 |
||||
 |
||||
chrisABC 
Senior Member 
Joined: 05 June 2008 Status: Offline Points: 258 |
 Post Options Post Options
 Thanks(0) Thanks(0)
 Quote Quote  Reply Reply
 Posted: 06 September 2009 at 8:10pm Posted: 06 September 2009 at 8:10pm |
|||
|
I got some VB code that allows capture of the image on the MarkupLabel.
This allows me to Print, Copy to Clipboard, or Save to .BMP file the chart images. I have uploaded it here, in case you want to try it: https://forum.codejock.com/forum_posts.asp?TID=15125&PID=52825#52825 |
||||
|
Chris (Manchester, UK) -- www.abc6.co.uk ---- Using CodeJock ActiveX Suite 13.1.0 with Windows8, VB6 SP6
|
||||
 |
||||
Post Reply 
|
|
|
Tweet
|
| Forum Jump | Forum Permissions  You cannot post new topics in this forum You cannot reply to topics in this forum You cannot delete your posts in this forum You cannot edit your posts in this forum You cannot create polls in this forum You cannot vote in polls in this forum |